A stockscreener is a very useful tool for investors who like to buy stocks themselves. With a stockscreener you can easily find stocks that are undervalued, like Warren Buffet likes to call them Value stocks. In this blog I will show you what it is and how it works.
What is a stockscreener?
A stockscreener is a tool, usually via a website, on which you can filter or rank a list of different stocks. Depending on the stockscreener you use, you can filter on many different fundamental and technical indicators. Think of the price/earnings ratio, price/book ratio, price/sales ratio, marketcap but also of the strongest gainers, strongest lossers or specific sectors and countries.
How most people look for shares
You have another nice bag of money ready to go. What do you do with it? You’d like to invest, but which shares? You could of course go for an ETF but you still prefer to choose yourself. Fine. How do you find the gem that gives you a good return and does not have too much risk?
You can look on different forums, like facebook, discord, reddit or maybe someone mentions a golden tip on Instagram? On forums the same stocks are usually mentioned. So by doing that you are in a trap.
You can also look on various websites, such as Fool, Yahoo Finance, Seeking Alpha or The Shareholder. But these also often discuss only a limited number of shares.
You can also listen to your neighbor or your uncle but they probably only promote their own stocks and are biased anyway.
Or you could use a stockscreener…
In short, how do you find stocks that you have never actually heard of! Searching through all lists is impossible. That’s why stockscreeners are so easy!
You’ll come across shares you’ve never heard of. Of course, this does not mean that they cannot be trusted. It just means that you have never heard of them… You can’t know everything.
As an investor, you are always biased in advance. And that ensures that you only look at stocks that you know. For example, via the news, forums, share tips and the sports canteen. Logical and very human, by the way. You can’t discuss shares you don’t know but you might miss great opportunities for return.
What stockscreeners are there?
What stockscreeners are there?
Stock screeners come in different shapes and sizes. Paid or free. Below you’ll find a list of free screeners (which often also have a paid version by the way):
- Yahoo Finance
- FinViz
- TradingView
- Simply Wall Street
- Tikr.com
Most stock screeners offer both fundamental and technical indicators. Not sure what they are? Then be sure to read this guide on getting started with investing or ask me to mail it to you in the comments.
All four stockscreeners have their own features. I particularly like FinViz for its accuracy. . It looks like crap (looks like a website from 10 years ago) but works well and offers pretty accurate numbers (just like Yahoo). You can select on quite a few indicators, both fundamental and technical. Furthermore, here is a preset with which you can easily find shares based on the CANSLIM investing method.
Simply Wall Street is also very good at this and they stand out because of the modern look. Moreover, you can print out a report per share nicely. However, I have read here and there that they are not always accurate. I haven’t checked that myself, by the way.
Then you have TradingView and they are the king of technical analysis. Also their stockscreener can do that pretty well. Although in my opinion you have to be pretty advanced to make chocolate out of that.
When do you use a stockscreener?
You use a stockscreener in 2 ways in my opinion. The 1st is to come up with new ideas or shares. This way you can very easily ‘screen’ the whole market and investigate further.
The 2nd option is to build a complete strategy based on a number of indicators. If a stock meets a number of preset requirements, then you buy it! There are many books written about this method of investing (quantitative data investing). A way of investing purely on huge amounts of data. Stock screeners are very suitable for this.
Do I use a stockscreener?
I use a lot of stockscreeners but I want to use them even more in the future. This way of investing suits me well (blue personality). A good book about big-data investing is ‘What works on Wall Street’ by James O’Shaughnessy and I can recommend it to anyone interested in this way of investing. He manages to get a 20% return per year (every year over a 40 year period!) with less risk than just buying everything on the US stock markets.
Quite an eye-opener because that means that risk and return do not always go hand-in-hand. So I thought that higher returns always meant more risk. I’m sure I’ll write more about this but at least know that a stockscreener is very important in this.
How does a stockscreener work?
Each stockscreener works slightly differently but in general they all work the same. You choose the indicators you want to select and the criteria they have to meet. Below I have a print screen of FinViz. Make sure you select ‘All’ in the dark gray bar, then you have all the options together. It can be a bit overwhelming but you will get used to it! Of course, you also need to understand some indicators. For that, I recommend checking out Investopedia. They offer a lot of information about the various indicators (including videos for lazy investors). Then you make a selection and apply the right criteria. Done.

Looking for a dividend share
To illustrate, let’s look for a nice dividend stock. You need to determine in advance what the criteria should be. For now, we are looking for a large company (above $10 billion) with a generous dividend (greater than 4%) and based in the United States. My preference is often for the United States because then the transaction costs at DEGIRO are very low. Because we want a healthy dividend, no more than 70% of the profit should go to the dividend. In my opinion, the company then still has enough left over for innovation or to reduce its debts.
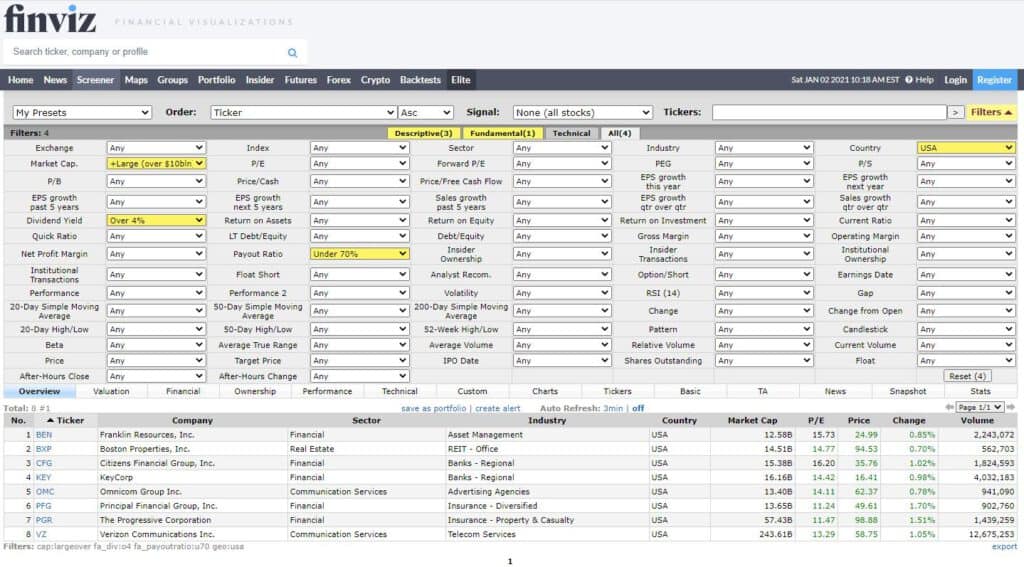
This is already a great start to explore further but we can look a little further. I also think it is important that the company does not have too much debt. That way it has more room to keep paying the dividend in the future. To do that, we now click on ‘Financial’ and then sort on ‘Debt/Eq’. This is the ratio of debts to assets. The closer to 0 the less debt.
I hope you understand a little bit how a stockscreener works. Do you think you will ever use a stockscreener? Or what do you think about a stockscreener? Let me know in the comments!
Warren Buffett Stock Screener – Find Stocks Like Warren Buffett ALL CRITERIA
- Market cap greater then 2 billion
- EPS growth past 5 years positive
- Operating margin better than industry average (or 10%)
- Net operating margin better than industry average (or 10%)
- ROE over 15%
- Current Debt to Equity better than current industry average or less than 0.5
- Price to free cashflow under 15
Link to the screener:


SETUP YOUR OWN WARREN Buffet PORTFOLIO
With the above screener you could build a long term portfolio :

You could eg. buy the top 10 best performing stocks and check at a predetermined interval to adjust or rebalance your portfolio once a year or every 6 months.

Finvz Screens to find stocks
Screens I found on the interenet let me know in the comments what you think about it.
- Shorted stocks – https://finviz.com/screener.ashx?v=131&f=cap_smallover,geo_usa,sh_avgvol_o500,sh_curvol_o500,sh_opt_optionshort,sh_price_o3,sh_relvol_o1,sh_short_high&o=-shortinterestshare
- Short squeeze – https://finviz.com/screener.ashx?v=131&f=sh_avgvol_o100,sh_instown_u50,sh_price_o2,sh_short_o15&ft=4&o=-shortinterestshare
- Weekly Earnings gap up – https://finviz.com/screener.ashx?v=141&f=earningsdate_tomorrowafter,sh_avgvol_o400,sh_curvol_o50,sh_short_u25,ta_averagetruerange_o0.5,ta_gap_u2&ft=4&o=-perfytd
- Bankruptcy squeeze candidates – https://finviz.com/screener.ashx?v=131&f=fa_pb_low,sh_short_o30&ft=4&o=-shortinterestshare
- Potential uptrend from weekly lows – https://finviz.com/screener.ashx?v=141&f=sh_avgvol_o400,ta_pattern_channelup,ta_perf_1wdown&ft=4&o=perf1w
- Bounce at moving average – https://finviz.com/screener.ashx?v=141&f=sh_avgvol_o400,sh_curvol_o2000,sh_relvol_o1,ta_sma20_pa,ta_sma50_pb&ft=4&o=-perf1w
- Oversold reversal – https://finviz.com/screener.ashx?v=111&f=sh_price_o5,sh_relvol_o2,ta_change_u,ta_rsi_os30&ft=4&o=price
- Oversold with upcoming earnings – https://finviz.com/screener.ashx?v=141&f=cap_smallover,earningsdate_thismonth,fa_epsqoq_o15,fa_grossmargin_o20,sh_avgvol_o750,sh_curvol_o1000,ta_perf_52w10o,ta_rsi_nob50&ft=4&o=perfytd
- New highs – https://finviz.com/screener.ashx?v=141&f=an_recom_buy,sh_price_u7,ta_change_u,ta_highlow20d_nh,ta_highlow50d_nh,ta_highlow52w_nh,ta_perf_dup&ft=4&o=-perf1w
- Breaking out – https://finviz.com/screener.ashx?v=141&f=fa_debteq_u1,fa_roe_o20,sh_avgvol_o100,ta_highlow50d_nh,ta_sma20_pa,ta_sma200_pa,ta_sma50_pa&ft=4&o=-perf1w
- SMA crossover – https://finviz.com/screener.ashx?v=141&f=fa_pe_profitable,sh_avgvol_o400,sh_relvol_o1,sh_short_low,ta_beta_o1,ta_sma50_cross20b&ft=4
- High Earnings growth – https://finviz.com/screener.ashx?v=141&f=fa_epsqoq_o25,fa_epsyoy_o25,fa_epsyoy1_o25,fa_salesqoq_o25,sh_avgvol_o400,ta_rsi_nos50,ta_sma200_pa&ft=4&o=-perfytd
- High Sales growth – https://finviz.com/screener.ashx?v=111&f=fa_debteq_u0.5,fa_roe_o15,fa_sales5years_o20,fa_salesqoq_o20,sh_avgvol_o200,sh_instown_o60,sh_price_o5,sh_short_u5&ft=4
- High relative volume – https://finviz.com/screener.ashx?v=131&f=fa_curratio_o1,fa_epsqoq_o15,fa_quickratio_o1,fa_salesqoq_o15,sh_avgvol_o400,sh_price_o5,sh_relvol_o1.5,ta_sma20_pa,ta_sma200_sb50,ta_sma50_sa200&ft=4&o=instown
- Consistent growth on a bullish trend – https://finviz.com/screener.ashx?v=141&f=fa_eps5years_pos,fa_epsqoq_o20,fa_epsyoy_o25,fa_epsyoy1_o15,fa_estltgrowth_pos,fa_roe_o15,sh_instown_o10,sh_price_o15,ta_highlow52w_a90h,ta_rsi_nos50&ft=4&o=-perfytd
- Buy and Hold value – https://finviz.com/screener.ashx?v=121&f=cap_microover,fa_curratio_o1.5,fa_estltgrowth_o10,fa_peg_o1,fa_roe_o15,ta_beta_o1.5,ta_sma20_pa&ft=4&o=-forwardpe
- Undervalued dividend growth – https://finviz.com/screener.ashx?v=111&f=cap_largeover,fa_div_pos,fa_epsyoy1_o5,fa_estltgrowth_o5,fa_payoutratio_u50,fa_pe_u20,fa_peg_low&ft=4&o=-pe
- Low PE value – https://finviz.com/screener.ashx?v=141&f=cap_smallunder,fa_pb_low,fa_pe_low,fa_peg_low,fa_roa_pos,fa_roe_pos,sh_price_o5&ft=4&o=-perfytd
- CANSLIM – https://finviz.com/screener.ashx?v=111&f=fa_eps5years_o20,fa_epsqoq_o20,fa_epsyoy_o20,fa_sales5years_o20,fa_salesqoq_o20,sh_curvol_o200&ft=4
If you have any questions feel free to put them in the comments, I’ll try to get back to you asap
This is not investing advise, read the site’s disclaimer

Leave a comment